Quality Check of a Genome Annotation
Foreword
Once an annotation is produced, it is essential to assess its reliability and completeness. There is no single “perfect” metric, and each method highlights different aspects of annotation quality. In practice, evaluation usually involves combining several complementary approaches.
Statistics
General statistics like number of predicted genes, their length, number of intron, etc gives you a sense of congruency with other builds or expectations for the species. However, it’s not a true quality metric: two annotations may have different gene counts without one being objectively “more correct.”
Search for the
AGATtoolkit in Galaxy
Select the
annotation statisticstool from the AGAT tool selector.Select your annotation file (GFF/GTF format).
Select your reference genome from history.
Run the tool
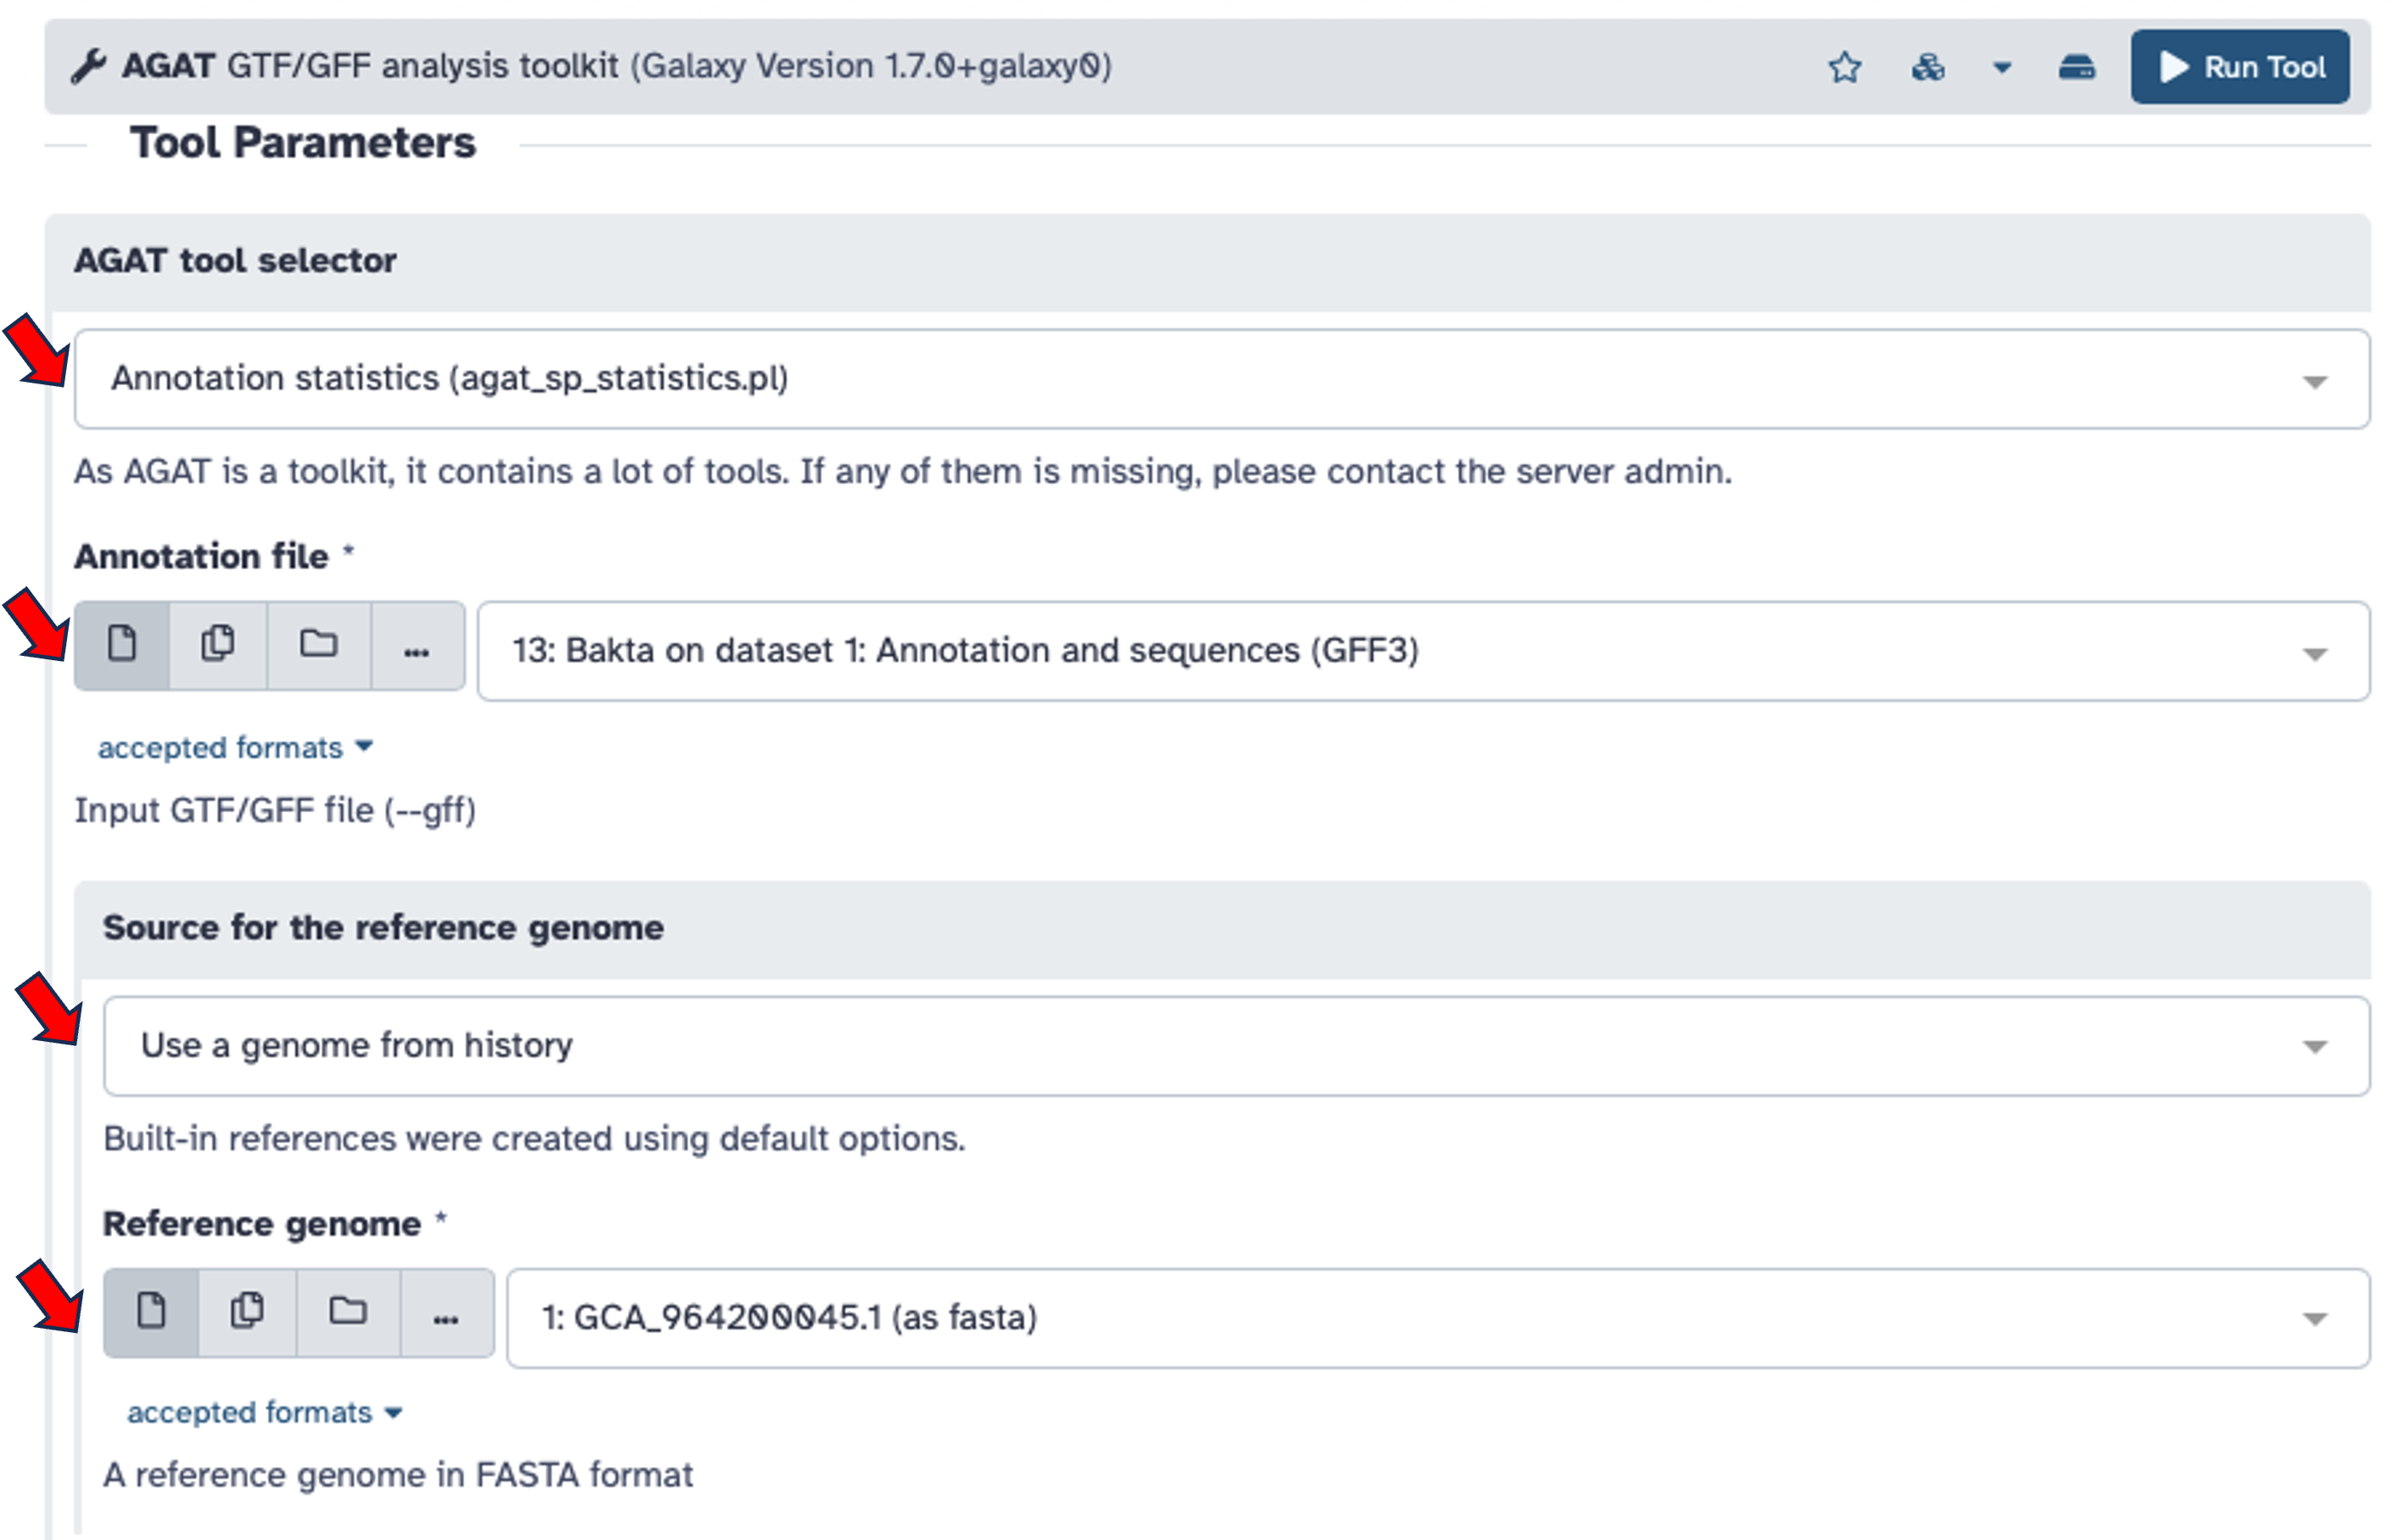
=> Look at the result by clicking on on the AGAT stats file line in your history on the right side.
Yes
Longest: 20778 bp
Shortest: 27 bp
BUSCO
BUSCO (Benchmarking Universal Single-Copy Orthologs) searches for sets of conserved genes that are expected to be present in nearly all genomes of a given lineage. The results indicate how many of these genes are complete, duplicated, fragmented, or missing (Simão et al. 2015).
The BUSCO results on proteins derived from the annotation should be similar to those obtained from BUSCO on the assembly itself (usually lower). If the annotation shows significantly lower completeness, it indicates that there is room for improvement in your annotation process. You need the protein set in fasta format of your annotation in order to run this BUSCO. If the annotation tool did not provide that data, you can extract the proteins from the GTF/GFF annotation using AGAT.
- Search for the
BUSCOtool in Galaxy
The full lineage for E. coli is:
Lineage (full): cellular organisms; Bacteria; Pseudomonadati; Pseudomonadota; Gammaproteobacteria; Enterobacterales; Enterobacteriaceae; Escherichia; Escherichia coliBUSCO using Bacteria lineage
In this first run we will use the Bacteria lineage to assess the completeness of our annotation assembly.
- Pay attention that you run BUSCO in genome mode.
- Select the appropriate lineage for your genome assembly.
- Run the tool to generate the BUSCO report.
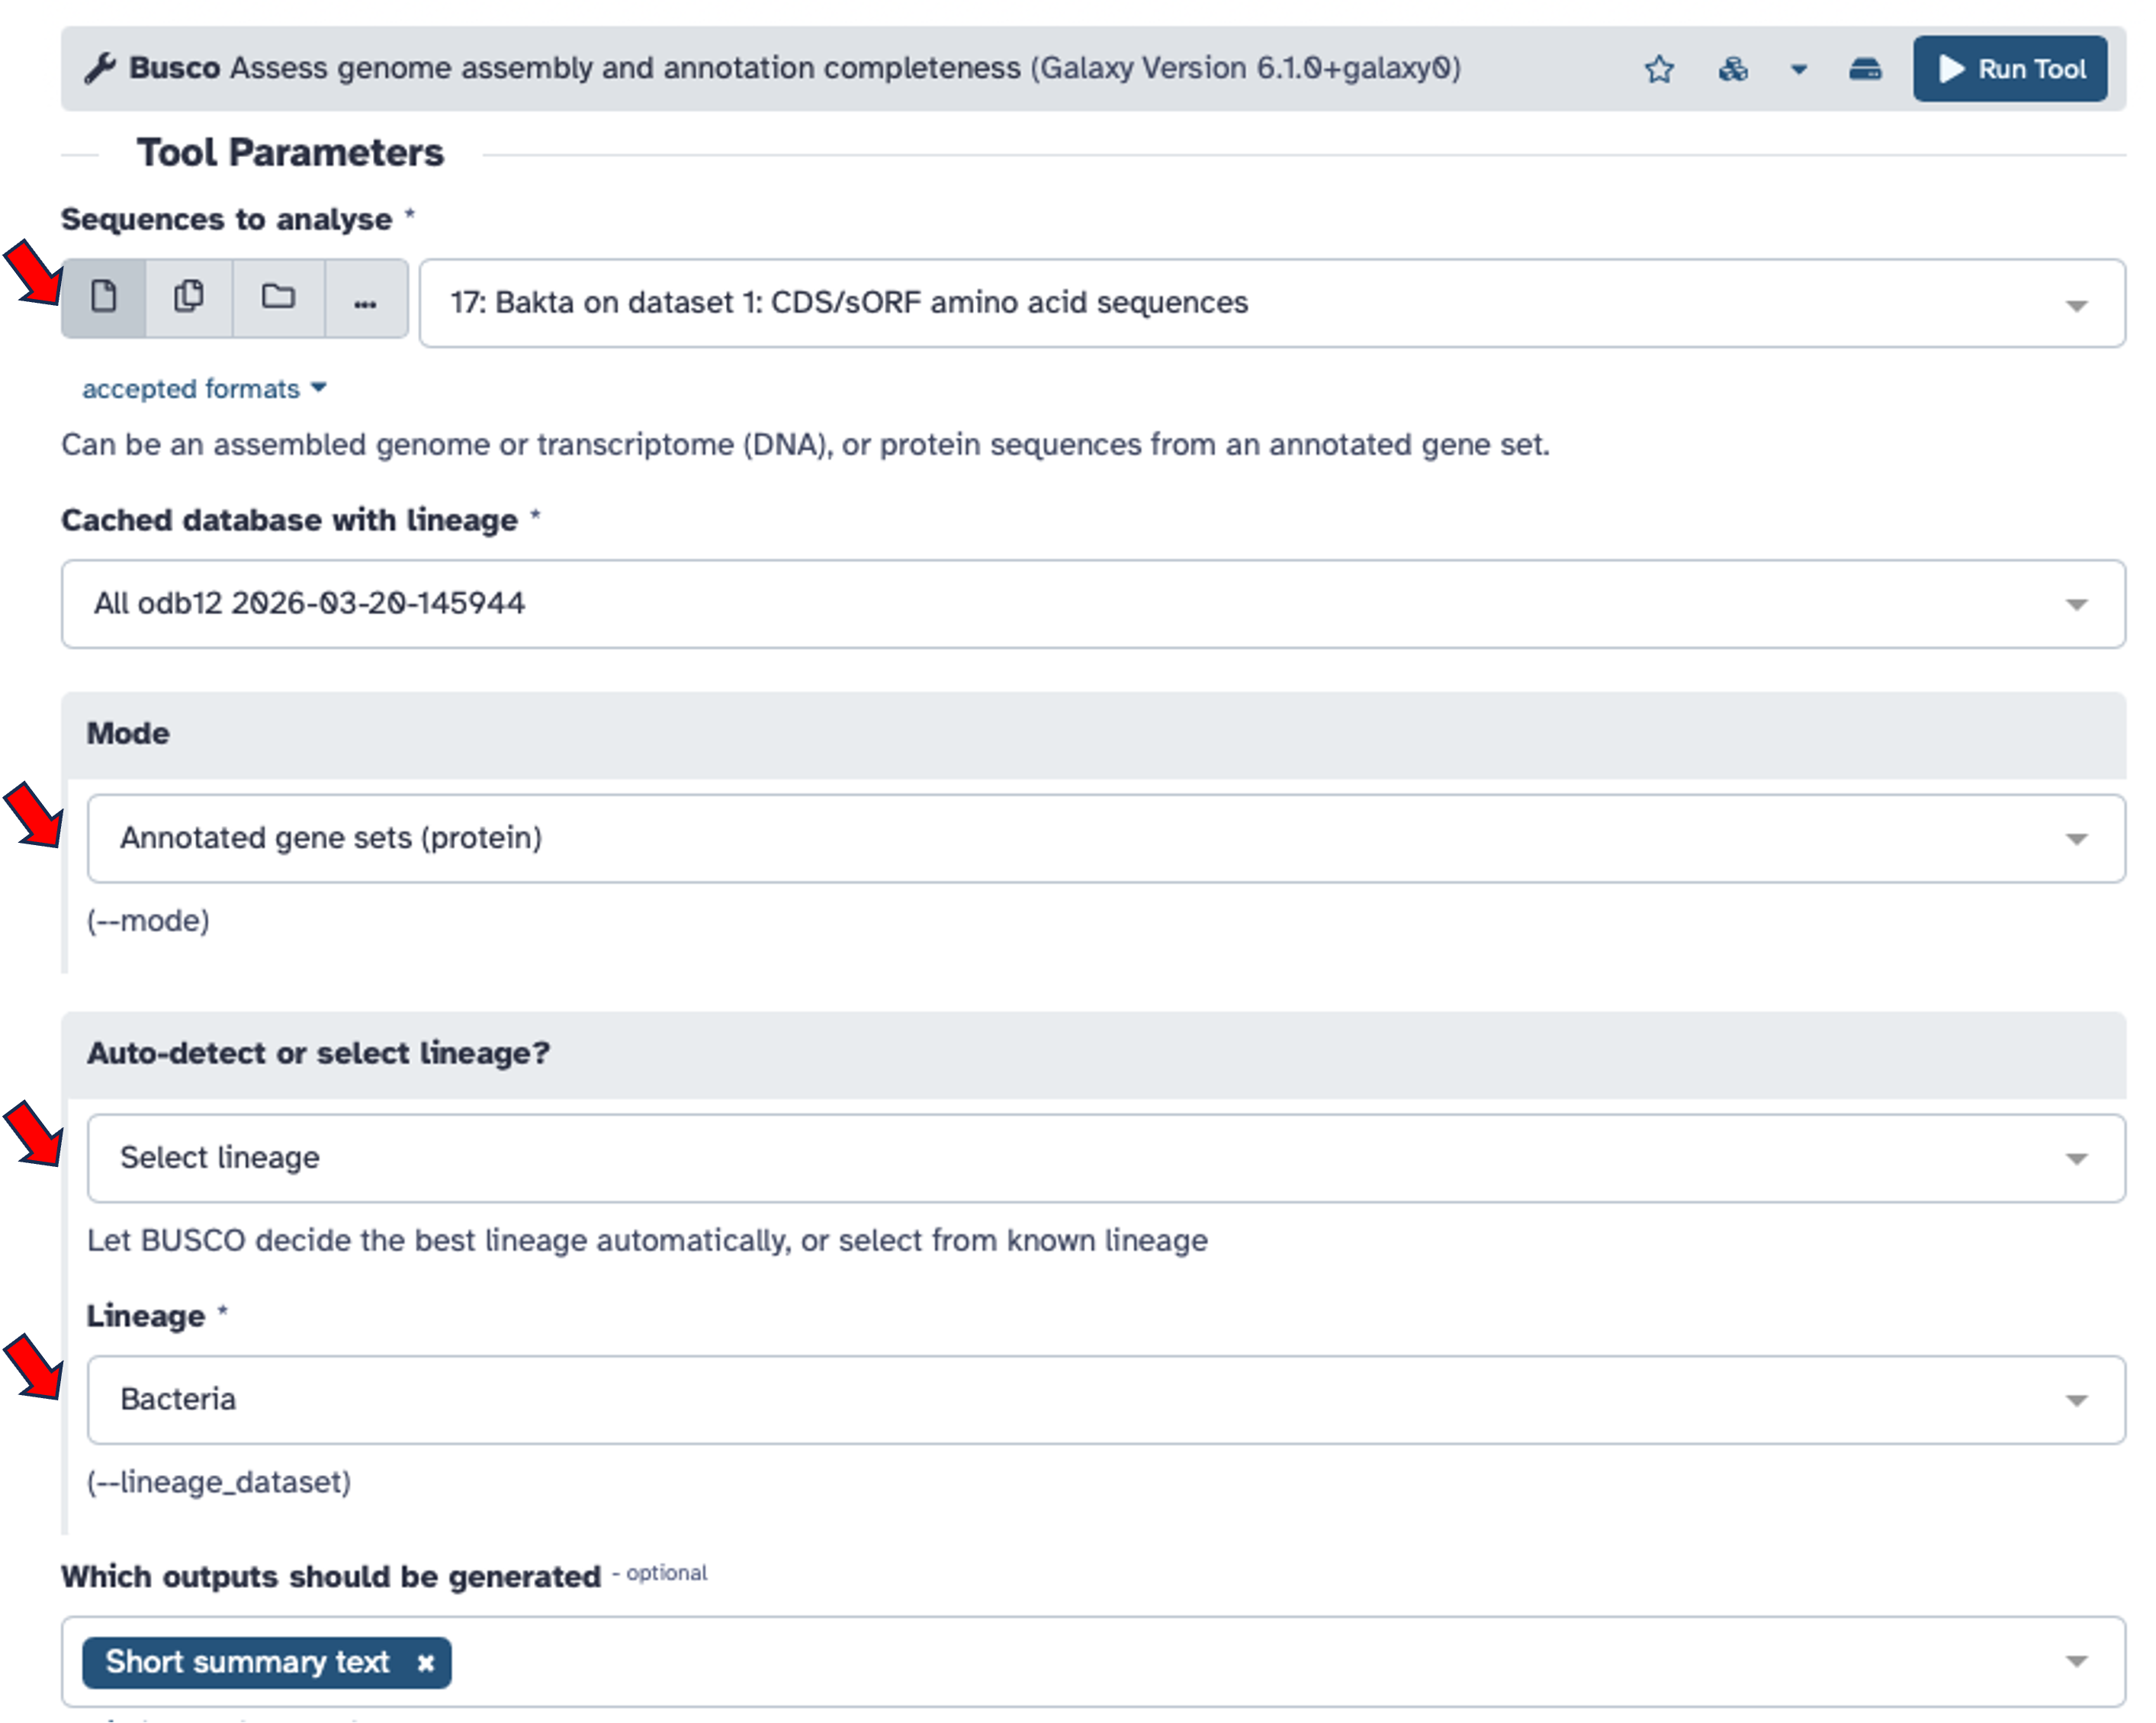
=> Look at the result by clicking on on the Busco Short summary line in your history on the right side.
C:99.1%[S:99.1%,D:0.0%],F:0.0%,M:0.9%,n:116.
Result on the annotation is slightly better than the assembly one. We have annotated expected genes. We even have a better result, it reflects that Bakta annotation process on this subset of gene is better than the annotation process used by BUSCO on the raw genome assembly.
BUSCO using Bacteria Enterobacteriaceae lineage
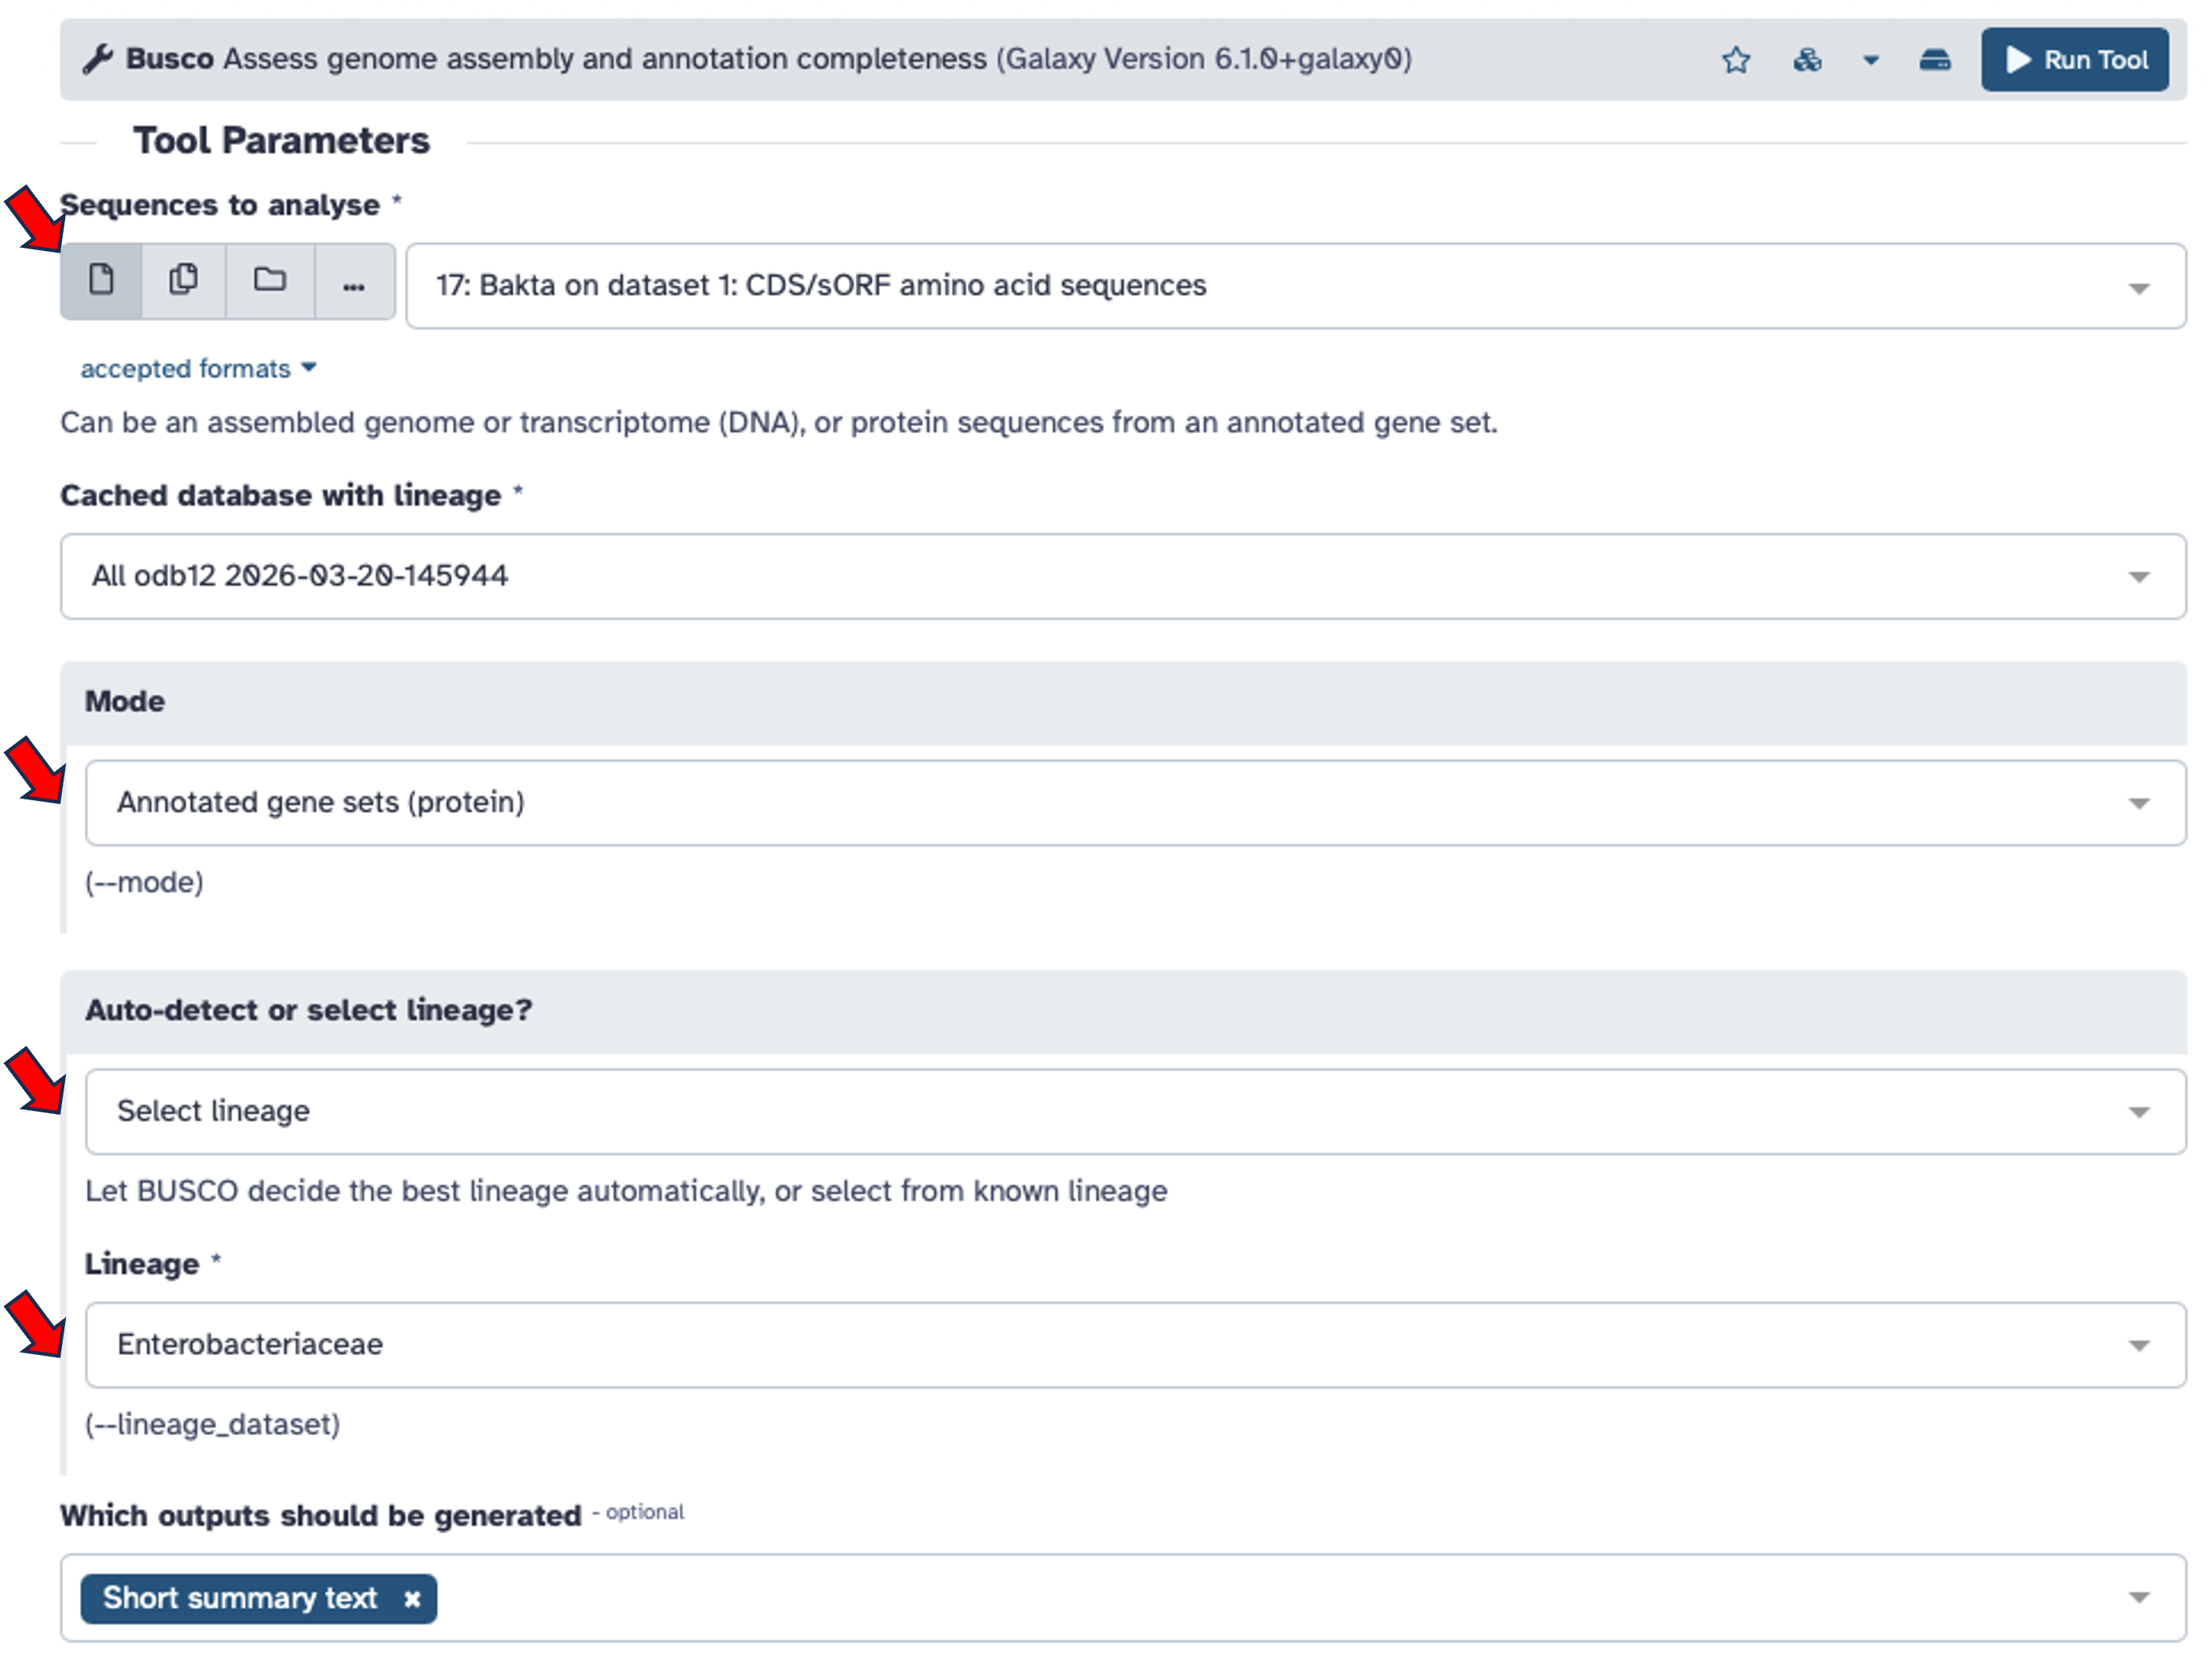
C:99.8%[S:99.5%,D:0.2%],F:0.1%,M:0.1%,n:874 We missed 1 BUSCO gene compared to the same analysis made on raw genome assembly. This is a common pattern. BUSCO use HMMs pattern design for a specific subset of gene, that might work better than approach used by the annotation tool used for annotation. This is not a problem, do not forget that we succedded to annotate much more gene thanks to Bakta.
Busco show we missed 1 gene over 874 total BUSCO groups searched. We annotated 5119 protein coding genes ith Bakta. Based on the busco result, we might have missed 6 genes (1*5119/874).